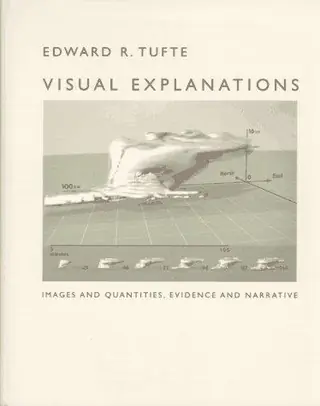
Visual Explanations
by Edward R. Tufte · first published 1997
52% recommend43% neutral5% critical
Why HN recommends it
Explores how images, data displays, and narratives explain causes and reasoning, using the Challenger case to show how information presentation shapes decisions. Recommended for programmers and visual reasoning fans.
Summarised by Claude from recommending comments
Jacket design: Dmitry Krasny. Other artwork by Bonnie Scranton, Dmitry Krasny, and Weilin Wu. Few would disagree: Life in the information age can be overwhelming. Through computers, the Internet, the media, and even our daily newspapers, we are awash in a seemingly endless stream of charts, maps, infographics, diagrams, and data. Visual Explanations is a navigational guide through this turbulent sea of information. The book is an essential reference for anyone involved in graphic, web, or multimedia design, as well as for educators and lecturers who use graphics in presentations or classes
Affiliate links. As an Amazon Associate I earn from qualifying purchases.
Mentions per year
What Hacker News says
Related books
 2007–2026
Envisioning Information
Edward R. Tufte
Recommended by 31 · mentioned by 4131 recommend · 41 mention31 recommend · 4131 recommend
 2008–2025
Beautiful Evidence
Edward R. Tufte
Recommended by 8 · mentioned by 238 recommend · 23 mention8 recommend · 238 recommend
 2007–2026
The Visual Display of Quantitative Information
Edward R. Tufte
Recommended by 100 · mentioned by 138100 recommend · 138 mention100 recommend · 138100 recommend
 2007–2026
The Elements of Typographic Style
Robert Bringhurst
Recommended by 85 · mentioned by 13585 recommend · 135 mention85 recommend · 13585 recommend
 2010–2026
Thinking in systems
Donella H. Meadows, Diana Wright
Recommended by 124 · mentioned by 163124 recommend · 163 mention124 recommend · 163124 recommend
 2007–2026
Don't Make Me Think
Steve Krug
Recommended by 237 · mentioned by 339237 recommend · 339 mention237 recommend · 339237 recommend
 2007–2026
Gödel, Escher, Bach
Douglas R. Hofstadter
Recommended by 505 · mentioned by 1,055505 recommend · 1,055 mention505 recommend · 1,055505 recommend
 2007–2026
The Pragmatic Programmer
Andy Hunt, Dave Thomas
Recommended by 353 · mentioned by 589353 recommend · 589 mention353 recommend · 589353 recommend
I read a really interesting article on this in my undergraduate software engineering course (an excerpt from Tufte's excellent "Visual Explanations" book dealing with the shuttle Challenger mishap). The main takeaway was not that it was malicious management, but rather that the _way the information was portrayed_ (slides) did a remarkably poor job…
on “Apollo 13: the Towing Invoice (2007)” ↗In “Visual Explanations” http://www.edwardtufte.com/tufte/books_visex Edward Tufte wrote a must-read analysis of why admonitions to postpone the launch were ignored.
on “Roger Boisjoly dies at 73; engineer tried to halt Challenger launch” ↗…learn lower-case "design thinking", my top 10 books * Design for Everyday Things - duh. I re-read chunks of it all the time. * Tufte - hard to pick one, I might actually be iconoclastic and go with Visual Explanations which I think has more to offer programmers over pure data visualization. Again, just grab one every day, flip through 3-4 pages, rinse, repeat. * User Story Mapping - Extremely memorable book - it gives…
on “Alan Kay's answer to ‘what are some forgotten books programmers should read?’” ↗…of Everyday Things: Donald A. Norman The Elements of Typographic Style, by Robert Bringhurst Visual Display of Quantitative Information by Edward R. Tufte, Envisioning Information by Edward R. Tufte Visual Explanations: Images and Quantities, Evidence and Narrative by Edward R. Tufte Beautiful Evidence by Edward R. Tufte Small Is Beautiful by E. F. Schumache The Art of Color by Johannes Itten Were I to teach a course,…
on “Required Reading for Product Designers” ↗…Escher Bach is fairly bible-ish if you ask me Another set of books I consider to be "one" bible are Edward Tufte's (1) The Visual Display of Quantitative Information, (2) Envisioning Information, (3) Visual Explanations and (4) Beautiful Evidence.
on “Ask HN: What book is considered the bible of your field/industry?” ↗"Proofiness" : https://www.amazon.com/Proofiness-Youre-Being-Fooled-Numbers... It is also a common tread in books by Tufte : https://en.wikipedia.org/wiki/Edward_Tufte I like "Visual Explanations: Images and Quantities, Evidence and Narrative" : https://www.amazon.com/Visual-Explanations-Quantities-Eviden...
on “Whom the Gods Would Destroy, They First Give Real-Time Analytics (2013)” ↗See also Ad Reinhard's blue paintings, which are combinations of very subtly different blues. I like them a lot and recently learned about them in Edward Tufte's excellent book Visual Explanations. https://www.google.com/search?q=ad+reinhardt+blue&tbm=isch
on “Three Colors: Blue” ↗There's value in visual representations of complex things. See for example Edward Tufte. People probably just think of him as visualizing data, but his book Visual Explanations goes into many other areas. My preference these days is to use a text-based representation to generate diagrams with tools like Structurizr DSL, WebSequenceDiagrams, PlantUML and Graphviz. The source…
on “Has UML died without anyone noticing?” ↗There are few books by the American Statistician Edward Tufte worth checking out. The Visual Display of Quantitative Information, Envisioning Information, and Visual Explanations, all exceptional works of art. The books act as both a teaching guide and a compendium of beautiful historical infographical-artifacts.
on “The United States Frequency Allocation Chart” ↗…answer is to use another kind of visualization (or perhaps use parallelism/small multiples to build up those kind of simple visualizations into something more meaningful). I personally find Tufte's book Visual Explanations to be his best book. It focuses much more on how good visualizations can help you explore data more readily (see what otherwise could not be seen), especially in regards to cause and effect. The Visual…
on “My favourite fonts to use with LaTeX (2022)” ↗…information, when done right. See, for instance [0][1][2][3] all by Edward Tufte. [0] "The Visual Display of Quantitative Information" https://www.amazon.com/Visual-Display-Quantitative-Informati... [1] "Visual Explanations: Images and Quantities, Evidence and Narrative" https://www.amazon.com/dp/0961392126 [2] "Beautiful Evidence" https://www.amazon.com/dp/0961392177 [3] "Envisioning Information" https://www.amazon.com/Envisioning-Information-Edward-R-Tuft...
on “A hexagonal-tiled cartogram for U.S. counties” ↗I remember the Challenger explosion like it was yesterday. I'll link here to a scan of the pages from Edward Tufte's book Visual Explanations about what went wrong with the data analysis during the launch planning, which understated the risk of a launch in cold weather. http://williamwolff.org/wp-content/uploads/2013/01/tufte-cha...
on “The result would be a catastrophe (1985)” ↗…books, but on the whole, The Baroque Cycle, which this is the second volume of, has been very educational and always entertaining) The Visual Display of Quantative Information, Envisioning Information, Visual Explanations, and Beautiful Evidence (I picked up all four books by Edward Tufte at his one day training course. At the 2011 SVG Open, I was blown away by Mike Bostock's D3 demo, and Niel Fraser told me to read all…
on “Ask HN: What are you reading? What've you read lately?” ↗…thinking about each graphic. Maybe start with the first few pages where Tufte lays out his criteria for graphical excellence. You may also want to look at his 2 subsequent books Envisioning Information and Visual Explanations wherein he goes into considerably more detail about particular aspects and techniques statistical graphics can use to show various types of patterns. I have probably spent 50 hours over the years studying…
on “How Useful Is Tufte for Making Maps? (2007)” ↗Check out Edward Tufte's books , from his webpage "Edward Tufte has written seven books, including Beautiful Evidence, Visual Explanations, Envisioning Information, The Visual Display of Quantitative Information, and Data Analysis for Politics and Policy. He writes, designs, and self-publishes his books on analytical design, which have received…
on “Good books on UI/UX design?” ↗