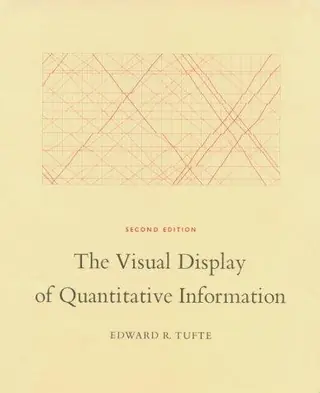
The Visual Display of Quantitative Information
by Edward R. Tufte · first published 1983
72% recommend22% neutral5% critical
Why HN recommends it
Gives developers and designers the vocabulary and theory for telling good charts from bad: data-ink ratio, clutter, and typography as structure, with historical examples. Suits anyone doing data visualization.
Summarised by Claude from recommending comments
The classic book on statistical graphics, charts, tables. Theory and practice in the design of data graphics, 250 illustrations of the best (and a few of the worst) statistical graphics, with detailed analysis of how to display data for precise, effective, quick analysis. Design of the high-resolution displays, small multiples. Editing and improving graphics. The data-ink ratio. Time-series, relational graphics, data maps, multivariate designs. Detection of graphical deception: design variation vs. data variation. Sources of deception. Aesthetics and data graphical displays. This is the second
Affiliate links. As an Amazon Associate I earn from qualifying purchases.
Mentions per year
What Hacker News says
Related books
 2007–2026
Envisioning Information
Edward R. Tufte
Recommended by 31 · mentioned by 4131 recommend · 41 mention31 recommend · 4131 recommend
 2010–2025
Visual Explanations
Edward R. Tufte
Recommended by 11 · mentioned by 2111 recommend · 21 mention11 recommend · 2111 recommend
 2011–2019
Thoughtful Interaction Design
Jonas Löwgren, Erik Stolterman
Recommended by 2 · mentioned by 32 recommend · 3 mention2 recommend · 32 recommend
 2008–2024
Information Dashboard Design
Stephen Few
Recommended by 25 · mentioned by 3025 recommend · 30 mention25 recommend · 3025 recommend
 2008–2025
Beautiful Evidence
Edward R. Tufte
Recommended by 8 · mentioned by 238 recommend · 23 mention8 recommend · 238 recommend
 2017–2024
Storytelling with Data
Cole Nussbaumer Knaflic
Recommended by 6 · mentioned by 76 recommend · 7 mention6 recommend · 76 recommend
Trees, maps, and theorems
Jean-Luc Doumont
Recommended by 3 · mentioned by 53 recommend · 5 mention3 recommend · 53 recommend
…Questions (Randall Munroe) 14: Hitchhiker's Guide to the Galaxy series (Douglas Adams) 15: Doing Good Better: How Effective Altruism Can Help You Make a Difference (William MacAskill) 16: The Visual Display of Quantitative Information (Edward Tufte) 17: Butterick's Practical Typography (Matthew Butterick)
on “Ask HN: I have no commitments for the next 6 months – what books should I read?” ↗What would Tufte say about someone that tried to "liberate" his beautiful, expensive and excellent books? Would he be outraged at the sight of "The Visual Display of Quantitative Information" available as a pdf on a torrent site? If Swartz and his ideas were so marvelous, why is Tufte still charging any money for his work?
on “Edward Tufte’s defense of Aaron Swartz and the “marvelously different”” ↗…how someone could get started in the field assuming that they already have a data-mining/statistics background. I personally know that a top recommendation would be reading the classic by Tufte "The Visual Display of Quantitative Information. What else is there on bookshelves and on the web?
on “Ask HN: How to get started in data visualization?” ↗Edward Tufte's book The Visual Display of Quantitative Information is a monumental book. He writes not about how to make your graphs look pretty, but how to display vast quantities of data and distill them down into useful graphics that communicate themselves effectively.…
on “Ask HN: Any good books on graphing/charting/visualization?” ↗The Visual Display of Quantitative Information - Edward Tufte All UI's are graphs at their heart
on “Ask HN: Good books or articles on UI design?” ↗Tufte's Visual Display of Quantitative Information and Carnegie's How to Win Friends and Influence People.
on “Startup founders, what books did you find most helpful?” ↗The Tufte books are brilliant. For dynamic charts, his first book (The Visual Display of Quantitative Information) is the most relevant, it covers the theory - how to tell a good representation from a bad one - and the basics. Readings in Information Visualization ( http://www.amazon.co.uk/Readings-Information-Visualization-I...…
on “Ask HN: Any good books on graphing/charting/visualization?” ↗Have you checked out the handful of books listed on the YCombinator "Startup Library" page (http://ycombinator.com/lib.html)?: Dale Carnegie: How to Win Friends and Influence People Edward Tufte: The Visual Display of Quantitative Information Paul Graham: Hackers and Painters Jessica Livingston: Founders at Work
on “Ask HN : What are some great books an aspiring entrepreneur should read?” ↗Big upvote for Edward Tufte. If you style yourself as a hardcore engineer, start with his book Visual Display of Quantitative Information. I'm away from my copy, but as I recall, John Tukey reviewed the manuscript. (http://en.wikipedia.org/wiki/John_Tukey)
on “Ask HN: I'm an engineer, how do I learn design?” ↗…hearing it mentioned by some podcast pundits I enjoy, I picked up a [dead tree] copy from Amazon. It is a beautiful and well written book. In some ways, the bookcraft it expresses reminds me of Tufte's Visual Display of Quantitative Information. But Petzold clearly is drawing more heavily on story-telling traditions making the book readable even for someone less interested in the technology.
on “Charles Petzold Departing MSDN Magazine” ↗The Visual Display of Quantitative Information: Edward R. Tufte Ways to Connect: On Interface and Product Design, Ryan Singer Something on color theory Design language books (Bauhaus, etc) The entire Google design team has quite a few open resources:…
on “Ask HN: What's the best book on modern UI/UX?” ↗See instead Tufte, Edward: The Visual Display of Quantitative Information (and the followup books) Few, Stephen: Information Dashboard Design
on “Design checklist for perfect charts” ↗Edward Tufte's book "The Visual Display of Quantitative Information" is a classic that is still relevant today. It was written before Excel charts etc but the key concepts, especially "less ink is better", is something that everyone should subscribe to. It also contains…
on “Unusual Maps” ↗I did a quick research on this topic sometime ago and the following was my conclusion. 1. The Visual Display of Quantitative Information - Edward Tufte 2. Storytelling With Data 3. Documentation pages of data Viz tools e.g. 1, 2, 3 depending on your programming language of choice. IMHO python ecosystem is still struggling with solid…
on “Ask HN: What is the best book on data visualization in 2021?” ↗…typography can be used to create structure. People who do not understand this use lines, planes, and volumes to create structure around content. A good place to learn about this is in Edward Tufte's The Visual Display of Quantitative Information (as well as its sequels). He vigorously recommends removing as much "non-data ink" as possible. Beyond structure, there is the issue of choosing typefaces. Let me just get this one out of the way: serif…
on “Ask HN: Recommendations for learning and improving UX/UI skills?” ↗