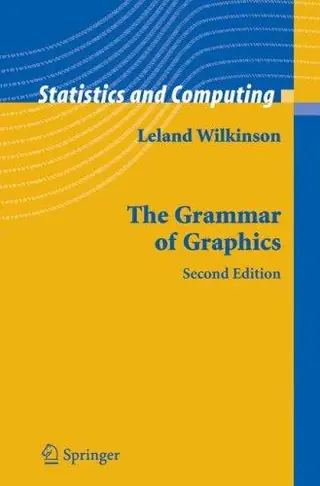
The grammar of graphics
by Leland Wilkinson, D. Rope · first published 1999
34% recommend64% neutral2% critical
Why HN recommends it
Framework for describing charts as composable parts, which inspired ggplot2 and d3.js. Suits people building visualization systems or wanting a rigorous, practical alternative to Tufte, with more worked examples.
Summarised by Claude from recommending comments
This book was written for statisticians, computer scientists, geographers, researchers, and others interested in visualizing data. It presents a unique foundation for producing almost every quantitative graphic found in scientific journals, newspapers, statistical packages, and data visualization systems. While the tangible results of this work have been several visualization software libraries, this book focuses on the deep structures involved in producing quantitative graphics from data. What are the rules that underlie the production of pie charts, bar charts, scatterplots, function plots,
Affiliate links. As an Amazon Associate I earn from qualifying purchases.
Mentions per year
What Hacker News says
Related books
 2009–2017
Ggplot2
Hadley Wickham
Recommended by 5 · mentioned by 65 recommend · 6 mention5 recommend · 65 recommend
 2015–2024
Visualization Analysis and Design
Tamara Munzner
Recommended by 6 · mentioned by 66 recommend · 6 mention6 recommend · 66 recommend
 2010–2023
The elements of graphing data
William S. Cleveland
Recommended by 6 · mentioned by 76 recommend · 7 mention6 recommend · 76 recommend
 2017–2024
Storytelling with Data
Cole Nussbaumer Knaflic
Recommended by 6 · mentioned by 76 recommend · 7 mention6 recommend · 76 recommend
 2012–2024
Interactive Data Visualization For The Web
Scott Murray
Recommended by 3 · mentioned by 73 recommend · 7 mention3 recommend · 73 recommend
 2009–2019
Visualizing Data
Ben Fry
Recommended by 7 · mentioned by 127 recommend · 12 mention7 recommend · 127 recommend
 2007–2026
The Visual Display of Quantitative Information
Edward R. Tufte
Recommended by 100 · mentioned by 138100 recommend · 138 mention100 recommend · 138100 recommend
 2008–2024
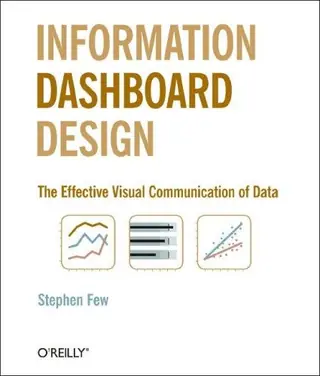
Information Dashboard Design
Stephen Few
Recommended by 25 · mentioned by 3025 recommend · 30 mention25 recommend · 3025 recommend
…https://flowingdata.com/2010/05/26/famous-science-fiction-quotes-in-graph-form/ ** http://www.visguy.com/2010/05/27/sci-fi-movie-quotes-visualized/ ** General composibility techniques with examples: ** "The Grammar of Graphics" by Leland Wilkinson ** R for Data Science : https://r4ds.had.co.nz/data-visualisation.html ** "Visualize This: The FlowingData Guide to Design, Visualization, and Statistics" : https://book.flowingdata.com/…
on “Ask HN: How would you spatialize higher dimensional data?” ↗…lol). This style might become dominant because it's only really possible in modern successors of C++ such as Swift or Rust, not so much in C++ itself. https://smile.amazon.com/review/R1MG7U1LR7FK6/ # Grammar of graphics https://www.amazon.com/Grammar-Graphics-Statistics-Computing... This book changed my perception of creativity, aesthetics and mathematics and their relationships. Fundamentally, the book provides all…
on “Ask HN: What's the best computer science book you've read recently?” ↗Concerning visualization I'd rather recommend Wilkinson's "The Grammar of Graphics" instead of Tufte's "The Visual Display of Quantitative Information", since the former contains much more practical examples and advice.
on “What every computer science major should know (2011)” ↗To dovetail off another HN thread (Free Springer math books)...after reading Bostock's piece, I suddenly realized that the classic Grammar of Graphics by Leland Wilkinson he quotes might be free...and it is! The 1999 version anyway: http://link.springer.com/search?query=grammar+of+graphics On Amazon, the cheapest available price is ~$55. For the second…
on “Introducing d3-scale” ↗…book "Exploratory Data Analysis" remains the place to start, if you can find a copy that doesn't cost a fortune. Casella wrote a book on experimental design that's solid. For visualizations Wilkinson's "Grammar of Graphics" and Tufte's books are the usual recommendations.
on “Ask HN: What are your favorite statistics and probability textbooks?” ↗Leland Wilkinson's "The Grammar of Graphics" http://www.amazon.com/Grammar-Graphics-Leland-Wilkinson/dp/0... is also excellent and fully implemented in the R programming language/statistics package ( http://www.amazon.com/ggplot2-Elegant-Graphics-Data-Analysis...…
on “Ask HN: Any good books on graphing/charting/visualization?” ↗There is this as well http://www.amazon.com/Enterprise-Dashboards-Design-Best-Prac... The The Grammar of Graphics (Statistics and Computing) by Leland Wilkinson is also great, though more focused on building graphing systems. I believe it is the inspiration for a lot of d3.js http://www.amazon.com/The-Grammar-Graphics-Statistics-Comput...
on “Your Startup Needs a Dashboard” ↗Recently I've been reading "Grammar of Graphics" which changed my perception of creativity, aesthetics and mathematics and their relationships. Fundamentally, the book provides all the diverse tools to give you confidence that your graphics are mathematically…
on “Lecture on Creativity (1991)” ↗I am a huge fan of Wilkinson's Grammar of Graphics and Hadley's implementation of them in ggplot2. Thanks for sharing this; it helps demo the power of the grammar. Since learning GG it has made me think of plotting in an additive fashion instead of before…
on “Tiny Art in Less Than 280 Characters (2017)” ↗…in its most simplest form, digest it using simple semiology and graphical grammer and move on. I find Cleveland et. al (Visualizing Data), Jacques Bertin (Semiology of Graphics) and Leland Wilkinson (Grammar of Graphics) much more 'scientific' in their approach than Tufte. Reading Tufte's books is akin to reading Josef Alber's - Interaction of Colors, which btw is the gospel of color theory amongst artists and designers:…
on “A Look at Overnight Stays at US National Parks” ↗…fundamentally, about an implementation of ideas. That the underlying idea, together with how well it's communicated through the API design and documentation, really matters. Reading Wilkinson's description of the grammar of graphics, and then seeing that translated to a code library... That was amazing. It defined what I think software is, as someone who was new to the world coming from an engineering background where coding was…
on “Ask HN: What are some “10x” software product innovations you have experienced?” ↗…to garbage data detector. Weather data suppliers have an unseemly habit of over as well as under reporting. :-) 2. SYGRAPH, the data visualizer Lee Wilkinson to accompany SYSTAT, before he wrote THE GRAMMAR OF GRAPHICS which we now now as ~ggplot2 3. NT 3.51 - the first vision of what a stable workstation could be 4. SSDs "20 times faster" but non-users can't process the meaning of those 3 perfectly good English words
on “Ask HN: What are some “10x” software product innovations you have experienced?” ↗…visualisation is the problem of mapping properties of your data to properties of the visualisation. Some good resources on this are The Visual Display of Quantitative Information - Edward Tufte The Grammar of Graphics - Leland Wilkinson FlowingData's guides - https://flowingdata.com/category/guides/ But from your list I gather that you're more interested in the visual design of things (colour schemes, fonts etc);…
on “Ask HN: What is the best book on data visualization in 2021?” ↗…visualization. Tamara Munzner's book "Visualization Analysis and Design" is a good starting point. There has been excellent work on identifying "dimensions" or properties of data visualization. Lee Wilkinson's "Grammar of Graphics" is a landmark. You could search backward to find Bertin's Semiology of Graphics, or forward to find ongoing work like UW's Vega https://idl.cs.washington.edu/papers/vega-lite/ Some of this work might…
on “A periodic table of visualization methods (2007)” ↗Yes, I would recommend "The Grammar of Graphics" for serious attempts to express visualizations: http://www.amazon.com/gp/aw/d/0387245448
on “Vega: A Visualization Grammar on top of D3” ↗