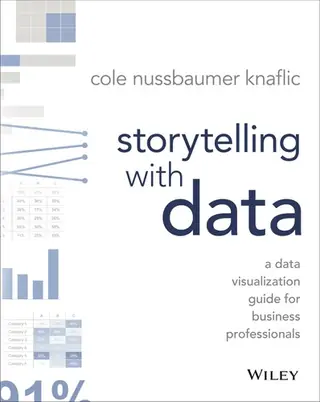
Storytelling with Data
A Data Visualization Guide for Business Professionals
by Cole Nussbaumer Knaflic · first published 2015
86% recommend14% neutral
Why HN recommends it
Practical guide to making charts that communicate a point, using before-and-after case studies and concrete advice on clarity and focus. Suggested for anyone who presents data to business audiences, especially beginners.
Summarised by Claude from recommending comments
Don't simply show your data—tell a story with it! Storytelling with Data teaches you the fundamentals of data visualization and how to communicate effectively with data. You'll discover the power of storytelling and the way to make data a pivotal point in your story. The lessons in this illuminative text are grounded in theory, but made accessible through numerous real-world examples—ready for immediate application to your next graph or presentation. Storytelling is not an inherent skill, especially when it comes to data visualization, and the tools at our disposal don't make it an
Affiliate links. As an Amazon Associate I earn from qualifying purchases.
Mentions per year
What Hacker News says
Related books
 2010–2023
The elements of graphing data
William S. Cleveland
Recommended by 6 · mentioned by 76 recommend · 7 mention6 recommend · 76 recommend
 2010–2026
The grammar of graphics
Leland Wilkinson, D. Rope
Recommended by 16 · mentioned by 4716 recommend · 47 mention16 recommend · 4716 recommend
 2007–2026
The Visual Display of Quantitative Information
Edward R. Tufte
Recommended by 100 · mentioned by 138100 recommend · 138 mention100 recommend · 138100 recommend
Storytelling with Data - because so many people are bad at PowerPoint: http://www.storytellingwithdata.com/book R for Data Science - because it is such a solid foundation for a career in business analytics: http://r4ds.had.co.nz…
on “Ask HN: What are the books you wish your colleagues had read?” ↗I did a quick research on this topic sometime ago and the following was my conclusion. 1. The Visual Display of Quantitative Information - Edward Tufte 2. Storytelling With Data 3. Documentation pages of data Viz tools e.g. 1, 2, 3 depending on your programming language of choice. IMHO python ecosystem is still struggling with solid visualization as compared to JavaScript…
on “Ask HN: What is the best book on data visualization in 2021?” ↗…to know from you?" Writing for other people is communication. What are you intending to communicate? Technique, as illustrated in this article, serves that intention. Cole Nussbaumer Knaflic's book "Storytelling with Data" is a good book on technical communication. TLDR: it's a process, and it's not about you, it's about them.
on “How to Edit Your Own Writing” ↗I really enjoyed Storytelling with Data: A Data Visualization Guide for Business Professionals by Cole Nussbaumer Knaflic. The author really breaks down the individual elements of good/bad visualizations using case studies with lots of actionable…
on “Friends don't let friends make certain types of data visualizations” ↗…your examples would be: don't neglect title, subtitle, and caption! They would be so easy to do well because you've already created your "simple headers thingies". A few words go along way. Check out "Storytelling with Data" by Cole Nussbaumer Knaflic for a great read on the subject. Owid's Grapher does those the best, IMO (followed closely by DataWrapper.de -- but that's not open source). At some point, if you keep up…
on “Eplot: A new package for making charts in Emacs” ↗A more useful book is Alberto Cairo's Storytelling with Data, great examples and the reasoning behind it. And yes I have Tufte's books too.
on “How Useful Is Tufte for Making Maps? (2007)” ↗…charts when it's now been shown that bar charts are processed faster and easier. Better Data Visualizations by Jonathan Schwabish is the best. He combines all the insight from recent data biz books like Storytelling with Data or Cairos series into a comprehensive guide. Even has a practical section on visualizing qualitative data, which I never see.
on “Ask HN: What is the best book on data visualization in 2021?” ↗