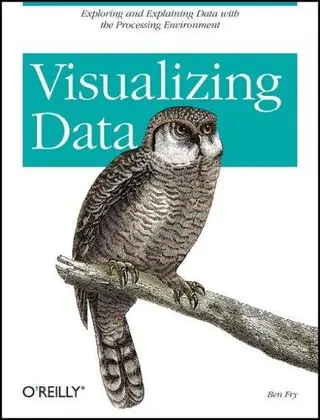
Visualizing Data
by Ben Fry · first published 2008
58% recommend42% neutral
Why HN recommends it
A technical rather than artistic guide to turning raw data into understandable visuals. It is easy to follow and useful for anyone learning data visualization. Written by the author of the Processing language.
Summarised by Claude from recommending comments
Provides information on the methods of visualizing data on the Web, along with example projects and code.
Affiliate links. As an Amazon Associate I earn from qualifying purchases.
Mentions per year
What Hacker News says
Related books
 2010–2023
The elements of graphing data
William S. Cleveland
Recommended by 6 · mentioned by 76 recommend · 7 mention6 recommend · 76 recommend
 2008–2024
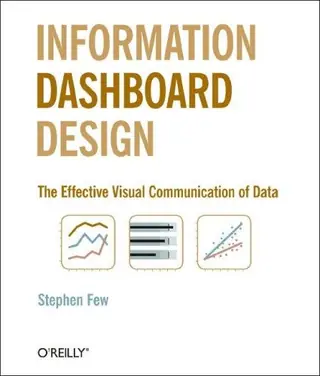
Information Dashboard Design
Stephen Few
Recommended by 25 · mentioned by 3025 recommend · 30 mention25 recommend · 3025 recommend
 2010–2026
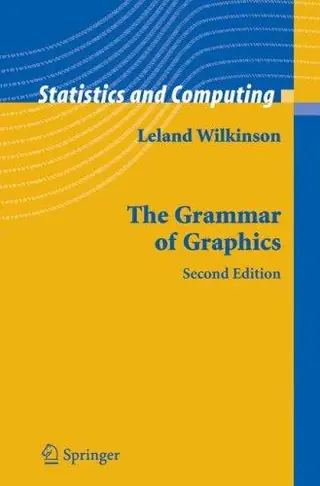
The grammar of graphics
Leland Wilkinson, D. Rope
Recommended by 16 · mentioned by 4716 recommend · 47 mention16 recommend · 4716 recommend
 2007–2026
The Visual Display of Quantitative Information
Edward R. Tufte
Recommended by 100 · mentioned by 138100 recommend · 138 mention100 recommend · 138100 recommend
…design and visualization is not "stunning infographics," it's finding ways to visualize data and make it more viscerally understandable. Ben Fry is an amazingly talented information designer, and his book Visualizing Data is a must-read for anyone interested in the field. Sadly, most of the "infographics" craze right now is focused on being "stunning" rather than being informative. Graphic designers run amok, creating…
on “This Man Can Teach You To Make Your Own Stunning Infographics” ↗I would check out Visualizing Data - http://oreilly.com/catalog/9780596514556 Also, I enjoy this site http://flowingdata.com.
on “Ask HN: Any good books on graphing/charting/visualization?” ↗…I've recently begun to learn how to display data in an intelligent manner. If anyone is interested, these books have helped me: Information Dashboard Design: http://oreilly.com/catalog/9780596100162 Visualizing Data: http://www.amazon.com/Visualizing-Data-Explaining-Processing... Beautiful Data: http://www.amazon.com/Beautiful-Data-Stories-Elegant-Solutio...
on “It’s OK to make an extra $2k per month if you’re a programmer. Here’s how.” ↗http://www.amazon.com/Visualizing-Data-Explaining-Processing... beautiful book by http://benfry.com/ http://infosthetics.com/ http://www.visualcomplexity.com/vc/ http://processing.org
on “Ask HN: How to get started in data visualization?” ↗Check out Visualizing Data by Ben Fry http://benfry.com/, one of the authors of the Processing language. The book is based on his doctoral dissertation, and has a technical (as opposed to artistic or design) focus, but is easy…
on “Ask HN: book recommendation for data visualization for beginners?” ↗…suggest checking out following resources: Books * Nathan Yau, Data Points Visualization that means something * Stephen Few, Information Dashboard Design The effective communication of data * OReilly, Visualizing Data Software * Tableau and example visualizations * D3.js and example visualizations
on “Ask HN: Best Data Visualisation Resources?” ↗…agree. Infographics and the like are a cancer to the graphics world. I want data in its most simplest form, digest it using simple semiology and graphical grammer and move on. I find Cleveland et. al (Visualizing Data), Jacques Bertin (Semiology of Graphics) and Leland Wilkinson (Grammar of Graphics) much more 'scientific' in their approach than Tufte. Reading Tufte's books is akin to reading Josef Alber's - Interaction…
on “A Look at Overnight Stays at US National Parks” ↗…sometimes an Excel spreadsheet. Don't be picky--just get it done. 2) Programmatically speaking, there are ways to represent truly massive terabyte datasets. - You can learn Processing (used by Ben Fry in Visualizing Data) which is based on Java and pretty simple to learn. My caveat is that you can't run these scripts server-side, that is, it doesn't generate jpgs or pngs on demand due to headless mode constraints. -…
on “Ask HN: Any good books on graphing/charting/visualization?” ↗chapter 6 of Ben Fry's book Visualizing Data.
on “"Top Secret America": The Washington Post's contracting investigation” ↗…books are wonderful; one example is "Graphic Discovery: A Trout in the Milk and Other Visual Adventures." They're non-technical, short chapters, discussions of different data sets. Bill Cleveland's "Visualizing Data" and "Elements of Graphing Data" cover the same material -- graphing data -- at a more technical level. I don't know Cleveland's books would help with the issues you asked about, but... they are amazing…
on “Try R — A new online course, for free” ↗Good catch. In the Visualizing Data book, Fry notes that he's using the lower-salaried team as the tiebreaker, and I took that as fact and didn't check the data (sigh; rookie mistake). I'll point that out in the article when I update it.
on “Edward Tufte's "Slopegraphs"” ↗I'm currently reading Star Trek The Fall: Revelation and Dust by David R. George and Oreillys Visualizing Data.
on “Ask HN: Which book are you reading these days?” ↗