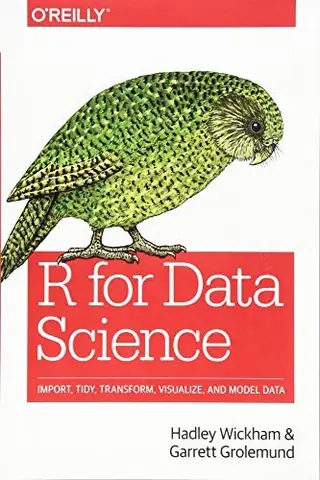
R for Data Science
Import, Tidy, Transform, Visualize, and Model Data
by Hadley Wickham, Garrett Grolemund · first published 2017
93% recommend5% neutral2% critical
Why HN recommends it
Free, beginner-friendly introduction to modern R and the tidyverse, with practical coverage of data manipulation with dplyr and visualization with ggplot2. Suits newcomers who want to explore and analyze data.
Summarised by Claude from recommending comments
Affiliate links. As an Amazon Associate I earn from qualifying purchases.
Mentions per year
What Hacker News says
Related books
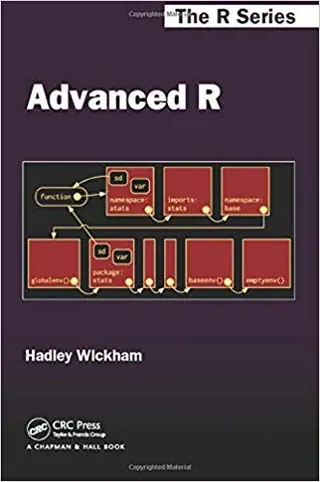 2014–2021
Advanced R
Hadley Wickham
Recommended by 9 · mentioned by 139 recommend · 13 mention9 recommend · 139 recommend
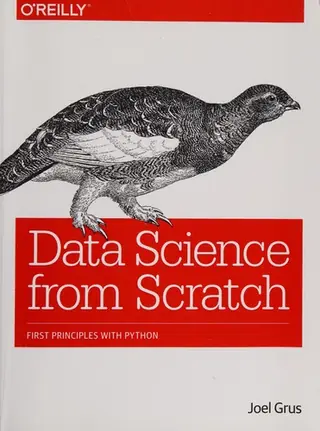 2015–2023
Data science from scratch
Joel Grus
Recommended by 22 · mentioned by 3322 recommend · 33 mention22 recommend · 3322 recommend
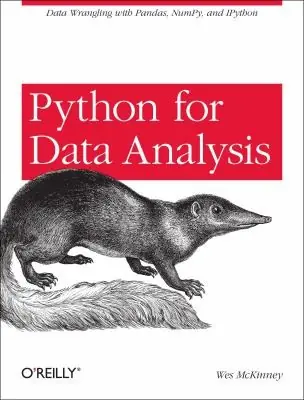 2012–2026
Python For Data Analysis
Wes McKinney
Recommended by 29 · mentioned by 5229 recommend · 52 mention29 recommend · 5229 recommend
 2009–2026
Bayesian data analysis
Andrew Gelman, John B. Carlin, Hal S. Stern, Donald B. Rubin
Recommended by 27 · mentioned by 4927 recommend · 49 mention27 recommend · 4927 recommend
 2013–2026
Data Smart
John W. Foreman
Recommended by 20 · mentioned by 2220 recommend · 22 mention20 recommend · 2220 recommend
 2014–2026
Introduction to Statistical Learning
Gareth James, Daniela Witten, Trevor Hastie, Robert Tibshirani
Recommended by 85 · mentioned by 10885 recommend · 108 mention85 recommend · 10885 recommend
 2016–2026
Statistical Rethinking
Richard McElreath
Recommended by 81 · mentioned by 9281 recommend · 92 mention81 recommend · 9281 recommend
 2007–2026
The Elements of Statistical Learning
Trevor Hastie, Robert Tibshirani, Jerome Friedman
Recommended by 144 · mentioned by 227144 recommend · 227 mention144 recommend · 227144 recommend
Hadley Wickham is the creator of ggplot2. His online book R for Data Science has a chapter on visualization which, besides being a good tutorial on using ggplot2, happens to be the most concise explanation of the theory that informs its design (the grammar of graphics).
on “R: Data Visualization by Hadley Wickham” ↗The “R for Data Science” book by Hadley Wickham (creator of tidyverse, and I believe he is chief data scientist at R Studio) is hands down one of the best introductions to data exploration and analysis.
on “R 4.0” ↗My personal favorite resource is "R for Data Science" by Hadley Wickham. It covers lots of nice data manipulation and visualization examples, and provides a good introduction to the tidyverse, which is a particular dialect of R that's well-suited for data…
on “Sculpting the moon in R: Subdivision surfaces and displacement mapping” ↗All the tutorials involve using base R packages. While OK for a tutorial, this is not reflective for real-world data analysis both in performance and usability, a lesson I have learned the hard way. (After using it for three semesters in college, I almost quit R completely in frustration) I recommend going straight to the Hadleyverse packages for the common use cases, and read the vignettes for t
on “Start here to learn R” ↗Trivial, self-serving question: is there a library for generating the diagram of table relationships here (13.2 nycflights13) http://r4ds.had.co.nz/relational-data.html And of course, thanks for another great book, it's helpful for learning R but I'm always enlightened by how thoroughly you explain the general concepts (e.g. Relational data and joins). Have heard a few people on faculty speak en
on “R for Data Science” ↗These tutorials are from 2014. While they provide a good overview of R syntax, a lot has been added to the R-verse such as dplyr, which the author primarily used for his Trump Tweets blog post yesterday. If you are interested in learning R, you may want to read the R for Data Science book (http://r4ds.had.co.nz/) book by dplyr (and ggplot2) author Hadley Wickham. Relatedly, I have my own (slight
on “Data Analysis and Visualization Using R (2014)” ↗The book "R for Data Science" by Garrett Grolemund and Hadley Wickham (O'Reilly, 2017) [1] provides a comprehensive introduction to modern R and a set of packages known as the tidyverse. Highly recommended. [1] http://r4ds.had.co.nz/
on “Introduction to R Programming” ↗Francois Cholet (author of Keras)'s Deep Learning with Python will be complete and fully published on the 20th of December: https://www.manning.com/books/deep-learning-with-python The chapters released so far are very good, the outlook chapters were extensively discussed on HN: https://blog.keras.io/the-limitations-of-deep-learning.html and https://blog.keras.io/the-future-of-deep-learning.html W
on “Ask HN: CS and programming books of 2017” ↗Storytelling with Data - because so many people are bad at PowerPoint: http://www.storytellingwithdata.com/book R for Data Science - because it is such a solid foundation for a career in business analytics: http://r4ds.had.co.nz And for extra credit two books I hope my collegues DON'T read since they are best kept secret are Cialdini's two books on influence: https://en.m.wikipedia.org/wiki/Robe
on “Ask HN: What are the books you wish your colleagues had read?” ↗I can't recommend the "R for Data Science" (https://r4ds.had.co.nz) book enough, which is written by one of the creators of the tidyverse, Hadley Wickham. This opinion might get challenged here, but if you're going to use R primarily for data science/analysis and not for programming I think it's a better idea to start learning it with the tidyverse than with base R (beyond the basics, of course, w
on “A Quick Introduction to R” ↗…https://flowingdata.com/2010/05/26/famous-science-fiction-quotes-in-graph-form/ ** http://www.visguy.com/2010/05/27/sci-fi-movie-quotes-visualized/ ** General composibility techniques with examples: ** "The Grammar of Graphics" by Leland Wilkinson ** R for Data Science : https://r4ds.had.co.nz/data-visualisation.html ** "Visualize This: The FlowingData Guide to Design, Visualization, and Statistics" : https://book.flowingdata.com/ ** Flowing data : https://flowingdata.com/2020/09/08/telling-stories-in-visual-data-driven-essays/
on “Ask HN: How would you spatialize higher dimensional data?” ↗I'd recommend reading http://r4ds.had.co.nz for an R workflow that eliminates a lot of those pain points. (Except for infix string concatenation - I've never really understood why people prefer that to paste(). Maybe if you're not thinking in vectors?)
on “R Passes SAS in Scholarly Use” ↗Course author here; I agree about most of the lessons being outdated in the last two years, and that R for Data Science is a great modern source. I'm working with DataCamp to develop an R course that covers dplyr, tidyr, and other newer additions to the R language.
on “Data Analysis and Visualization Using R (2014)” ↗For statistical programming, since we're talking about R, I strongly recommend R for Data Science (http://r4ds.had.co.nz) by Hadley Wickham (who created a large amount of the R packages that are very commonly used [tidyverse] and incidentally also now works for RStudio) A good book on statistical theory is harder to come by, though.
on “Advantages of Using R Notebooks for Data Analysis Instead of Jupyter Notebooks” ↗I'm a scientist (PhD student in microbiolgy) that works with lots of data. My data is on the order of hundreds of gigabytes (genome collections and other sequencing data) or megabytes (flat files). I use the `tidyverse` from R[0] for everything people use `pandas` for. I think the syntax is soooo much more pleasant to use. It's declarative and because of pipes and "quosures" is highly readable. C
on “Ask HN: As a data scientist, what should be in my toolkit in 2018?” ↗